|
PIE
CHARTS
Mr.
Miller Math Project
GARYMILLER@NISD.NET Scenario | Task | Resources | Product | Rubric | TEKS | Feedback | Credits |
|
ScenarioWhen you have an income producing job after school, you will have to budget your paycheck to your living expenses. Sometimes spreadsheets are dull and confusing, but a pie chart will show just where your money goes each month. If you are out on your on, you will be responsible for making money and spending money. With a possible career or job in mind, you will need to know your income and your expenses to stay out of debt; and a pie chart (or circle chart) will help you decide if your expenses are excessive. |
|
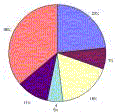
TaskOn an individual basis, as everyone may not have similar career goals, each student will decide on a career goal and determine the estimated monthly income that job in Texas might provide. This job search does not necessarily be your career choice, but one in which you can find good information on expected income. Personal knowledge by family members is acceptable. Then with an known income, prepare a listing of expenses that will be necessary to meet your lifestyle; such things as a car, an apartment, clothes, entertainment, and taxes. Once you have determined all the known expenses, prepare a 'pie chart' to show the relative importance of certain expenses. All expenses are segments of the 'pie' and must add up to 100% of income. The pie chart should be drawn in color to easily see the expense segments, and a side chart to show the individual percentages. |
|
ResourcesCareer & Graphs Hotlist of helpful web siteswhen working on the assignment, to help start a student toward a career choice and graphing software. This list is not all inclusive and there exists many more sites which can be found by doing web searches in a search engine. CAREER CHOICES
Create a Graph - Design
and
print out program, very powerful and offers a lot of information on all
types of graphs |
|
ProductThe finished product will be a poster or PowerPoint presentation showing your career monthly income, your expected monthly expenses, and a pie chart of the expenses. In the income section, some information will need to be provided to explain the career and how to achieve that career. The expenses should be real world costs you will be required to pay for your lifestyle. Remember that taxes is a monthly expense that most overlook when making a list of where their money goes. The main item to produce is a pie chart of the expenses, in color, with a chart showing all the segments adding up to 100%. If making a poster, this could be a printed sheet from a computer program, and then pasted onto the board. If using PowerPoint, then this would be a separate page. |
|
RubricYou will find the standards for this projects listed in the CIRCLE CHART RUBRIC. |
|
TEKS§111.33. Algebra II (a) Basic understandings. (5) Tools for algebraic thinking. Techniques for working with functions and equations are essential in understanding underlying relationships. Students use a variety of representations (concrete, numerical, algorithmic, graphical), tools, and technology, including, but not limited to, powerful and accessible hand-held calculators and computers with graphing capabilities and model mathematical situations to solve meaningful problems. (b) Foundations for functions: knowledge and skills and performance descriptions. (B) In solving problems, the student collects data and records results, organizes the data, makes scatterplots, fits the curves to the appropriate parent function, interprets the results, and proceeds to model, predict, and make decisions and critical judgments. To better understand our course, please refer to a presentation about TEKS. |
|
FeedbackClick HERE to give the teacher some feed back on your project. |
|
Credits for this ProjectTexas Education Agency TEKS: RubiStar Rubric Builder UTSA Course 5063 |
|
|
|
